The Spreadsheet view
View, sort, and edit all properties for all objects in all profiles

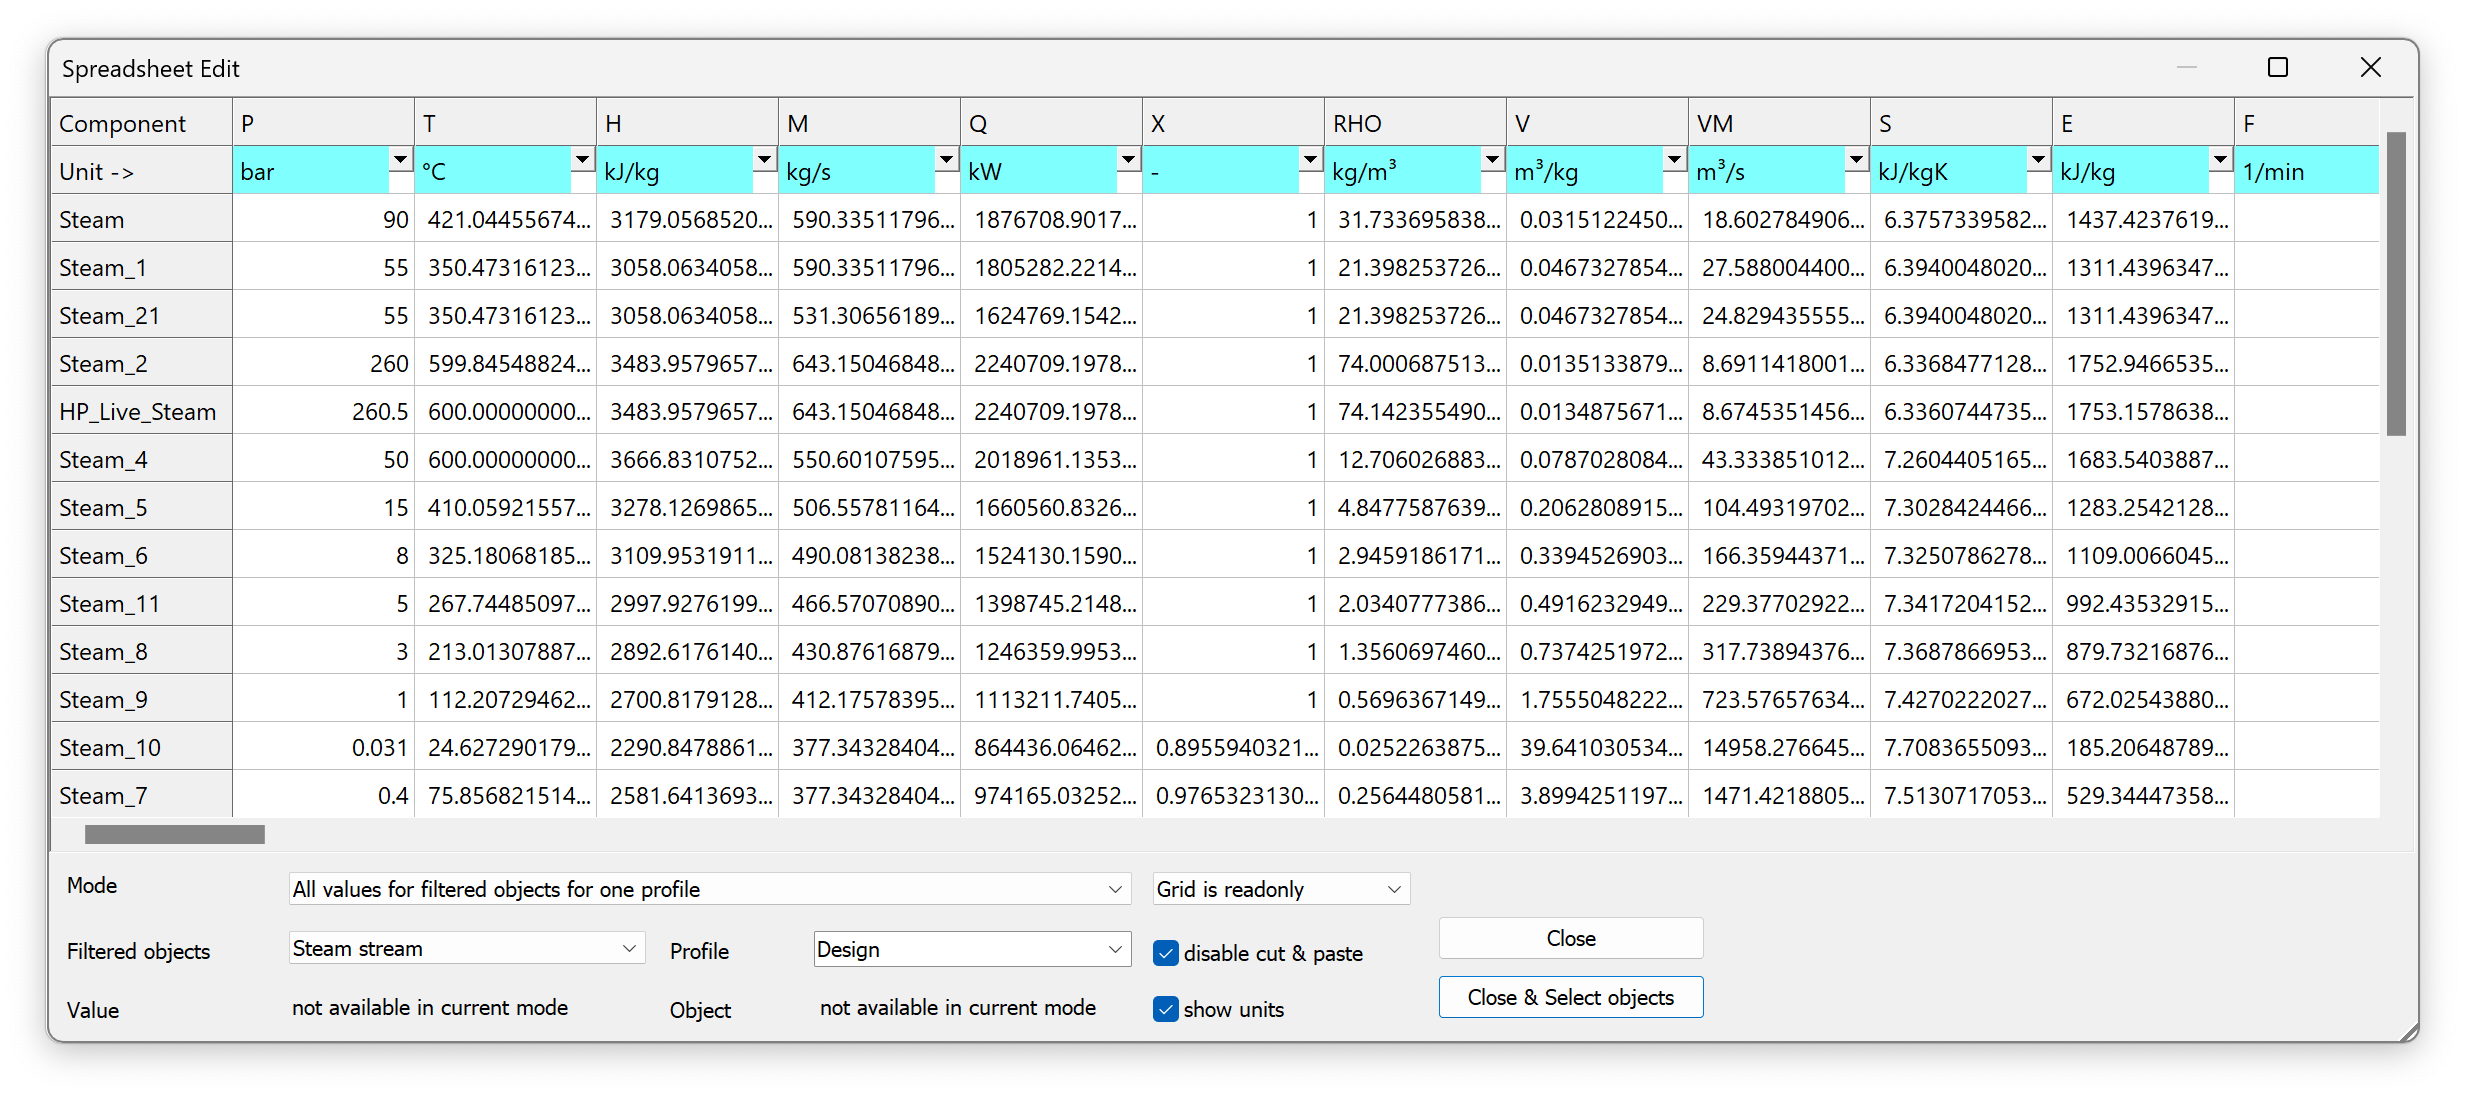
When you hit the “Edit in spreadsheet button”:

you’ll see a window with a 2-D table:
There’s a key concept here. There are 3 dimensions of data in the model:
Profiles
Objects (pipes and components)
Properties of those objects
You can select two of those to have in the rows and columns with the “Mode” button:
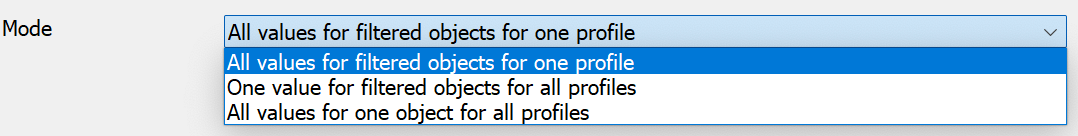
and then you will be able to select the “one profile”, “one value”, or “one object” to show in the table data.
Let’s look at each of these in order.
“All values for filtered objects for one profile”
Here, I’ve selected Steam Stream and the Design Profile.
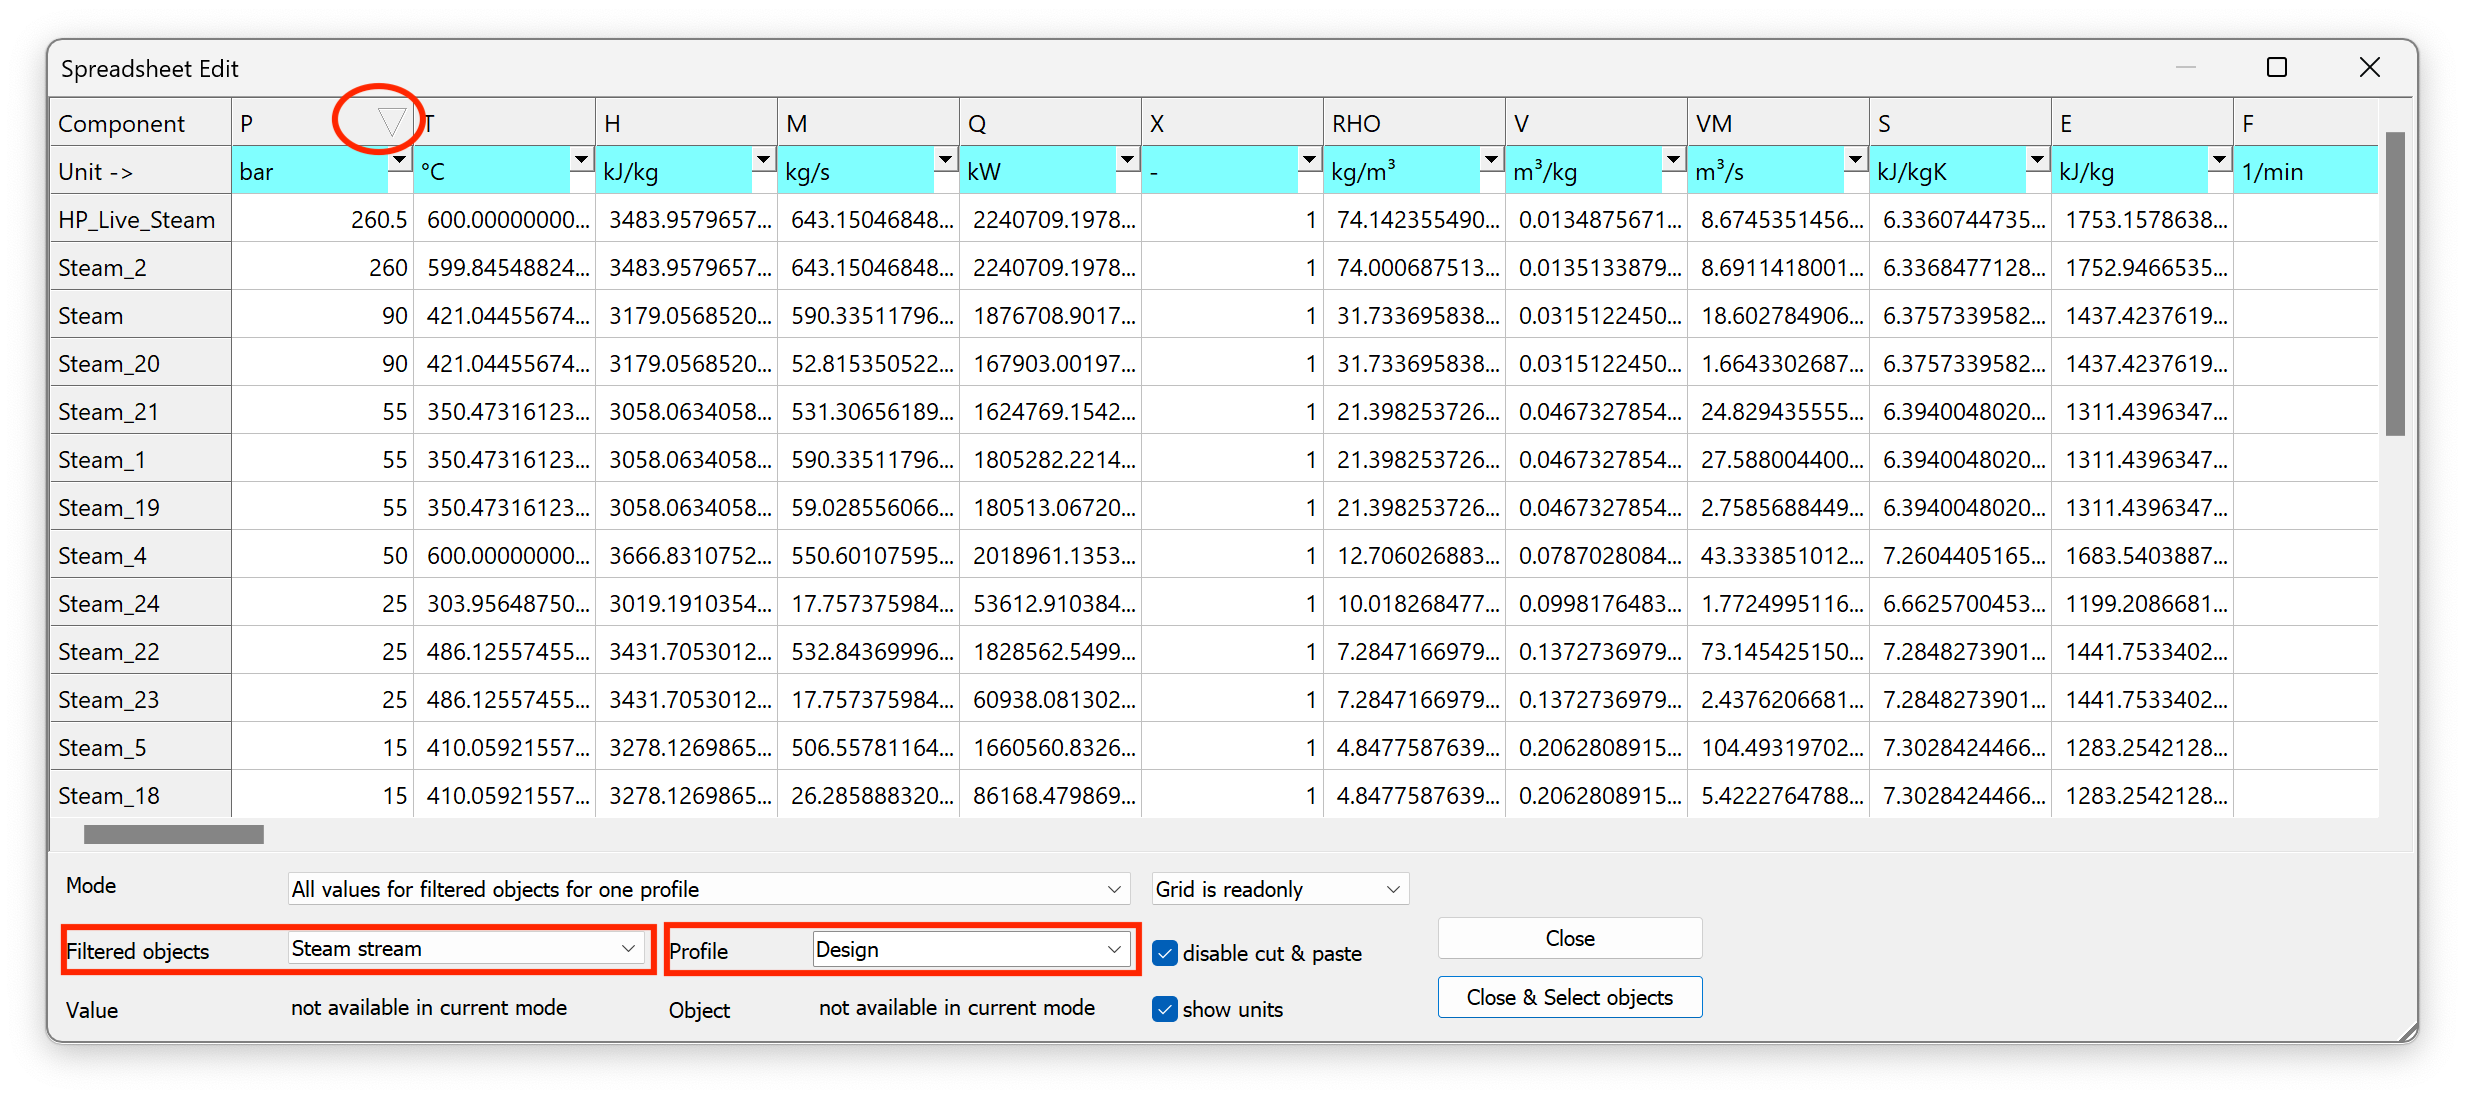
This shows EVERY property for EVERY steam pipe in the specified profile.
I double-clicked the header of the Pressure column, which sorts those values. We can see that the pipe with the highest pressure in the Design profile is the “HP_Live_Steam” pipe.
“One value for filtered objects for all profiles”

Here, I’ve selected Liquid Water Stream, and Temperature, which shows the temperature for EVERY water pipe in EVERY profile.
NOTE: you can also look at a selected property of a type of Component. Here, I’m looking at the FDAMP of all Comp 39 Controllers in every profile:
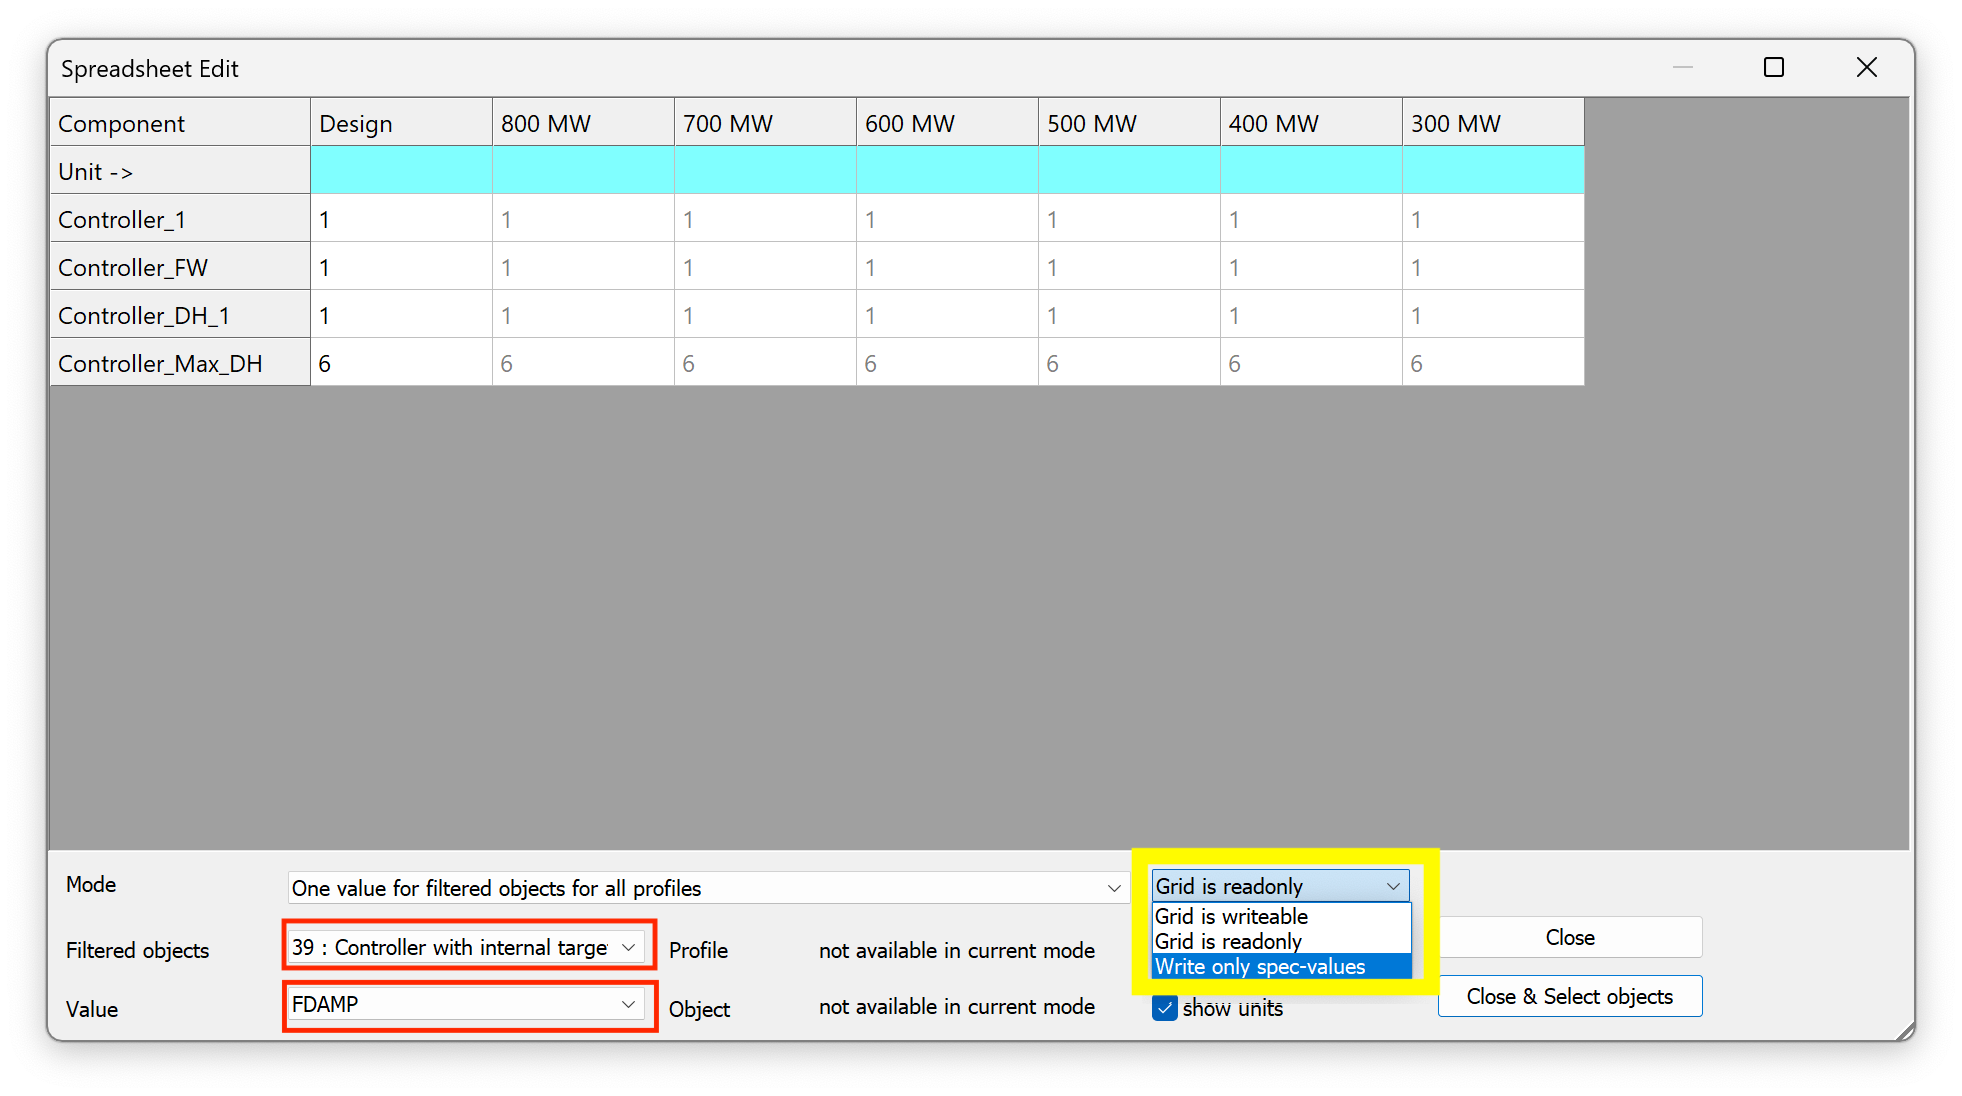
Furthermore, you can EDIT these values! Change “Grid is readonly” to “Write only spec-values” and you can make changes in the table.
“All values for one object for all profiles”
Here, I’ve selected that “HP_Live_Steam” pipe that we looked at earlier. This shows EVERY property for that one pipe in EVERY profile.
I double-clicked the VM column to see which profile had the highest volumetric flow rate in that pipe.

If you select an object, then hit “Edit in Spreadsheet”, that Object will be pre-selected for this view. You can of course change it via the “Object” drop-down.
Final comment
You can select-all and copy / paste data between these “Spreadsheets” and Excel. To paste INTO the Spreadsheet, un-check this box: